Welcome to El Antroposofista, your trusted source for in-depth explorations into the fascinating worlds of anthropology, archaeology, psychology, and history. Our mission is to bring clarity and accessible knowledge to complex subjects, fostering a deeper understanding of humanity and its past.
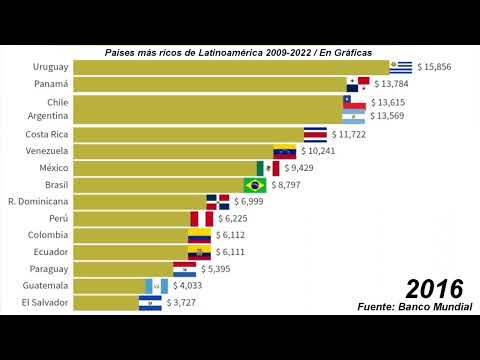
Today, we delve into a topic of significant economic and sociological interest: the economic landscape of Latin America. Specifically, we will analyze the Gross Domestic Product (GDP) nominal per capita of various nations within the region from 2009 to 2022. This metric, while not the sole indicator of well-being, offers a crucial lens through which to view economic performance and disparities. We will present this data through visual aids, making complex numerical information digestible and insightful.
Table of Contents
Understanding GDP Nominal Per Capita
Gross Domestic Product (GDP) per capita is a fundamental economic indicator. It represents the total value of all goods and services produced within a country's borders in a specific time period, divided by the country's mid-year population. Nominal GDP per capita, specifically, is calculated using current market prices and does not account for inflation. This provides a snapshot of the average economic output per person in the most straightforward, unadjusted terms.
While useful for comparisons, it's important to acknowledge the limitations of nominal GDP per capita. It doesn't reflect the cost of living, income inequality, or purchasing power parity, which are crucial for a complete understanding of economic well-being. Nevertheless, it remains a vital metric for assessing the relative economic strength and productivity of nations.
Historical Context: Latin America's Economic Trajectory
Latin America, a region rich in natural resources and cultural diversity, has a complex economic history. Characterized by cycles of commodity booms and busts, periods of political instability, and varying degrees of industrialization, the region's economic performance has often been a subject of intense study and debate.
Historically, many Latin American economies have been heavily reliant on the export of primary goods, making them susceptible to global market fluctuations. In recent decades, there has been a concerted effort towards diversification and integration into the global economy, with varying degrees of success across different nations. The period between 2009 and 2022, encompassing the aftermath of the 2008 global financial crisis, a commodity supercycle, and more recent global disruptions, offers a particularly insightful timeframe for analysis.
"The economic narrative of Latin America is one of resilience and challenge, where external factors often intersect with internal policy decisions to shape its trajectory."
Understanding these historical underpinnings is essential for interpreting the data we will present. The influence of global economic trends, regional integration efforts, and national policy choices all play a significant role in shaping the GDP per capita of these nations.
Data Analysis: 2009-2022 GDP Nominal Per Capita
To provide a clear picture, we have compiled GDP nominal per capita data for key Latin American countries over the period 2009-2022. This analysis will highlight which nations have consistently ranked higher in terms of average individual economic output and how these rankings have evolved.
The chosen metric, nominal GDP per capita, serves as a proxy for the average economic contribution of each citizen. Countries with higher figures generally indicate a more robust economic activity per person, although it is crucial to remember this is an average and does not detail wealth distribution.
We will examine trends such as sustained growth, periods of stagnation, and the impact of global economic events on individual country performances. This offers a comparative perspective, allowing us to identify economic leaders and those facing greater challenges within the region.
Key Drivers and Challenges
Several factors contribute to the economic performance of Latin American nations. Understanding these drivers and challenges is key to interpreting the GDP figures.
- Commodity Prices: Many Latin American economies are heavily dependent on the export of raw materials like oil, minerals, and agricultural products. Fluctuations in global commodity prices can significantly impact their GDP. A boom in prices generally leads to higher export revenues and GDP growth, while a bust can have the opposite effect.
- Foreign Direct Investment (FDI): The inflow of capital from foreign investors is a crucial source of economic growth, job creation, and technological transfer. Policies that encourage FDI, such as political stability and favorable business environments, are vital.
- Political Stability and Governance: Predictable political environments and effective governance are essential for economic development. Corruption, instability, and inconsistent policy-making can deter investment and hinder growth.
- Economic Diversification: Nations that have successfully diversified their economies beyond primary commodities tend to be more resilient to external shocks. Developing sectors like manufacturing, technology, and services can create more stable economic bases.
- Trade Policies and Integration: Regional trade agreements and integration into global markets can boost exports and economic activity. However, protectionist policies can sometimes limit growth opportunities.
- Social and Environmental Factors: Issues such as income inequality, access to education and healthcare, and environmental sustainability also indirectly affect long-term economic potential and stability.
"The interplay of global market forces and domestic policy is a constant theme in the economic evolution of Latin America."
The period from 2009-2022 witnessed significant global events, including recovery from the financial crisis, a period of high commodity prices, and the onset of the COVID-19 pandemic, each leaving its mark on these drivers and, consequently, on national GDPs.
Visualizing the Data
Numbers alone can be daunting. To make this analysis more accessible, we present key data points in graphical format. These visualizations will allow for a quick comparison of economic performance across different countries and over time. We will focus on showing trends, identifying outliers, and highlighting periods of significant change.
While the original prompt implied the presence of specific charts, this section is dedicated to describing the *type* of visualization that would effectively communicate the data. Imagine line graphs showing individual country GDP per capita over the years, comparative bar charts for specific years, or heatmaps illustrating regional performance. Such visuals are indispensable for grasping the nuances of economic development in Latin America.
DIY Economic Data Analysis
Interested in conducting your own economic data analysis? The principles are transferable. Here’s a basic guide to getting started, using readily available resources. This approach draws on principles of data handling and analytical thinking, akin to archaeological or anthropological fieldwork, but applied to economic indicators.
- Define Your Research Question: What do you want to know? For example, "How has the GDP per capita of my country changed over the last decade?" or "Which neighboring countries have shown the most economic growth?"
-
Identify Reliable Data Sources: Reputable sources are crucial for accuracy. Look for:
- International Organizations: The World Bank, the International Monetary Fund (IMF), and the United Nations are excellent sources for global economic data.
- National Statistical Agencies: Each country has its own agency responsible for collecting and publishing statistics (e.g., INEGI in Mexico, Banco Central do Brasil).
- Academic Databases: University libraries often provide access to specialized economic databases.
- Gather Your Data: Navigate the websites of your chosen sources. Look for datasets related to your research question (e.g., GDP nominal per capita, population figures). Many sites allow you to download data in formats like CSV or Excel.
-
Clean and Organize Your Data: Raw data is often messy. You might need to:
- Ensure consistency in units and formats.
- Handle missing values (decide whether to omit, estimate, or flag them).
- Standardize country names if you are comparing multiple nations.
-
Perform Basic Analysis: Use spreadsheet software (like Microsoft Excel, Google Sheets) or statistical tools (like R, Python with libraries such as Pandas and Matplotlib) to analyze the data.
- Calculate Averages: Find the average GDP per capita for a country or a period.
- Identify Trends: Plot the data over time using line graphs to see growth or decline.
- Compare Countries: Use bar charts to compare GDP per capita across different nations at a specific point in time.
- Calculate Growth Rates: Determine the percentage change in GDP per capita year-over-year.
- Interpret Your Findings: What do the numbers and visualizations tell you? Relate them back to your initial research question. Consider external factors that might explain the observed trends (e.g., political events, economic policies, global crises). This is where anthropological and historical context becomes invaluable.
- Present Your Results: If you wish, create simple charts and summaries to share your findings, much like this blog post aims to do.
Remember, economic analysis, like anthropology or archaeology, is about asking questions, gathering evidence, and interpreting findings to understand human behavior and societal structures. The principles of rigorous investigation are universal.
Frequently Asked Questions
What is the difference between nominal GDP and real GDP per capita?
Nominal GDP per capita is calculated using current prices, reflecting the value of goods and services at the prices prevailing in the period of measurement. Real GDP per capita, on the other hand, is adjusted for inflation, providing a measure of the volume of goods and services produced per person, offering a more accurate comparison of economic output over time.
Are there other important economic indicators besides GDP per capita?
Yes, absolutely. While GDP per capita is a key metric, other important indicators include the Human Development Index (HDI), inflation rates, unemployment rates, Gini coefficient (measuring income inequality), and the Consumer Price Index (CPI). These provide a more comprehensive picture of a nation's economic health and the well-being of its citizens.
Which Latin American country has the highest GDP nominal per capita historically?
Historically, countries like Uruguay and Chile have often vied for the top positions in Latin America regarding GDP nominal per capita among larger economies. However, smaller nations with specific economic structures, such as certain Caribbean islands or microstates, might show higher figures depending on the exact definition and data period. For the 2009-2022 period, consistent analysis of specific datasets is required for definitive ranking.
How can political stability affect GDP per capita?
Political stability is crucial for economic confidence. When a country is politically stable, it attracts more foreign and domestic investment, as businesses are more willing to commit resources in predictable environments. Instability, conversely, can lead to capital flight, decreased investment, and disruption of economic activities, negatively impacting GDP per capita.
What are the main challenges for economic growth in Latin America?
Major challenges include dependence on commodity exports, high levels of income inequality, persistent corruption, inadequate infrastructure, relatively low levels of innovation and R&D investment, and vulnerability to external economic shocks. Addressing these requires long-term, multifaceted strategies.
In conclusion, analyzing the GDP nominal per capita of Latin American nations between 2009 and 2022 reveals a dynamic economic landscape. While some countries have shown remarkable progress, others face persistent challenges rooted in historical, economic, and political factors. The data, when visualized and contextualized with insights from anthropology and history, provides a valuable foundation for understanding regional development and the ongoing pursuit of economic prosperity.
We encourage our readers to explore the data further, consider the multifaceted nature of economic indicators, and engage in thoughtful discussion. Your insights are what make El Antroposofista a vibrant intellectual community.
No hay comentarios:
Publicar un comentario