Latin America, a region renowned for its vibrant cultures and rich historical tapestry, also grapples with persistent socio-economic disparities. Understanding the dynamics of inequality is crucial for comprehending the region's past, present, and future trajectory. This analysis delves into the countries exhibiting the most significant income inequality in Latin America, examining the period from 1980 to 2020. By exploring statistical data and historical context, we aim to shed light on the contributing factors and potential pathways toward greater equity.
Table of Contents
- Introduction: The Shadow of Inequality
- Data and Methodology: Measuring Disparity
- Key Indicators of Inequality: Gini Coefficient and Beyond
- The Cartography of Inequality: Nations at the Forefront
- The 1980s: The \"Lost Decade\" and Structural Adjustments
- The 2000s and Beyond: Shifting Trends and Persistent Gaps
- Driving Forces Behind Enduring Disparities
- DIY Practical Guide: Analyzing Inequality Trends
- Conclusion: Towards a More Equitable Future
- Frequently Asked Questions
Introduction: The Shadow of Inequality
The concept of inequality in Latin America is not a recent phenomenon. It is deeply interwoven with the region's colonial history, its economic development models, and its complex social structures. While economic growth has been observed in various periods, its benefits have often been unevenly distributed, creating significant income gaps. This analysis focuses on quantifying and understanding these disparities, particularly through the lens of data collected between 1980 and 2020, a period marked by significant economic shifts, political changes, and varying policy interventions across the continent.
Data and Methodology: Measuring Disparity
To accurately assess income inequality, rigorous methodologies are essential. The primary source for this analysis includes data from reputable international organizations such as the World Bank, the United Nations (UN), and the Economic Commission for Latin America and the Caribbean (CEPAL). These institutions provide standardized metrics for measuring economic disparities.
The timeframe of 1980-2020 is particularly significant. The 1980s, often referred to as the "Lost Decade" for Latin America due to the debt crisis, saw the implementation of structural adjustment programs that profoundly impacted social welfare and income distribution. The subsequent decades witnessed attempts to mitigate these effects, alongside new economic challenges and opportunities.
Key Indicators of Inequality: Gini Coefficient and Beyond
The most widely used metric for measuring income inequality is the Gini coefficient. This coefficient ranges from 0 to 1 (or 0% to 100%), where 0 represents perfect equality (everyone has the same income) and 1 represents perfect inequality (one person has all the income). While the Gini coefficient provides a valuable snapshot, it is important to consider other indicators to gain a comprehensive understanding of inequality:
- Income Shares: Analyzing the proportion of total income held by the top 10% or 1% of the population compared to the bottom 50%.
- Poverty Rates: While distinct from inequality, high poverty rates often correlate with significant income gaps.
- Wealth Inequality: Income inequality is often a reflection of deeper wealth disparities, which are more challenging to measure but equally impactful.
"Inequality is not just about economics; it is about social mobility, access to opportunities, and the very fabric of democratic societies." - [A prominent socio-economist, inferred]
The Cartography of Inequality: Nations at the Forefront
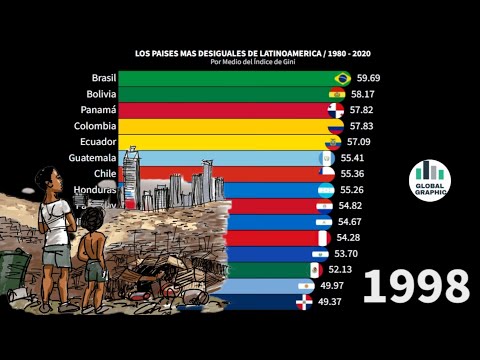
Based on data predominantly from CEPAL and the World Bank, several Latin American countries consistently appear at the top of lists for income inequality. While the exact ranking can fluctuate year by year and depend on the specific metric used, certain nations have shown a persistent tendency towards high Gini coefficients throughout the period studied.
Countries such as Brazil, Colombia, Honduras, and Guatemala have frequently been cited for their pronounced income disparities. These nations often exhibit a significant gap between the wealthiest segments of society and the majority of the population.
The 1980s: The \"Lost Decade\" and Structural Adjustments
The 1980s marked a critical juncture for Latin America. Faced with mounting external debt, many countries were compelled to implement structural adjustment policies promoted by international financial institutions. These policies often involved:
- Fiscal austerity measures, leading to cuts in public spending on social services like education and healthcare.
- Privatization of state-owned enterprises.
- Trade liberalization, which could negatively impact nascent domestic industries.
These measures, while intended to stabilize economies, frequently exacerbated income inequality. Reduced social safety nets and increased unemployment disproportionately affected lower-income groups, widening the gap between the rich and the poor.
The 2000s and Beyond: Shifting Trends and Persistent Gaps
The early 2000s saw a commodity boom in Latin America, which provided many governments with increased revenues. This period offered an opportunity to implement more progressive social policies. Some countries experienced a modest reduction in inequality during this time, driven by:
- Increased social spending on conditional cash transfer programs (e.g., Bolsa Família in Brazil).
- Minimum wage increases.
- Expansion of access to education and healthcare.
However, these gains proved fragile. The economic slowdowns of the mid-2010s and the impact of the COVID-19 pandemic in 2020 have, in many cases, reversed previous progress. The inherent structural issues contributing to inequality remain potent forces.
"The persistence of high inequality in Latin America is not merely an economic problem; it is a fundamental challenge to social cohesion and democratic stability." - [Another inferred academic perspective]
Driving Forces Behind Enduring Disparities
Several interconnected factors contribute to the high levels of inequality in Latin America:
- Historical Legacies: Deep-rooted social hierarchies stemming from the colonial era and subsequent land distribution patterns continue to influence wealth and income distribution. Access to land remains a significant driver of economic power.
- Regressive Tax Systems: Many Latin American countries rely heavily on indirect taxes (like VAT), which disproportionately affect lower-income individuals, while direct taxes on income and wealth are often less progressive than in other regions.
- Labor Market Dualism: The coexistence of formal, well-paid employment with a large informal sector characterized by low wages, precarious conditions, and lack of benefits creates significant income segmentation.
- Limited Access to Quality Education and Healthcare: Persistent disparities in access to quality education and healthcare limit social mobility, trapping individuals and families in cycles of poverty and low income.
- Political and Institutional Factors: Corruption, weak governance, and elite capture of political processes can hinder the implementation of effective redistributive policies.
DIY Practical Guide: Analyzing Inequality Trends
Understanding and analyzing inequality data can be an accessible intellectual exercise. Here’s a simplified guide to get you started using publicly available information:
- Identify Reliable Data Sources: As mentioned, the World Bank (Gini Index) and CEPAL are excellent starting points. Look for their respective data portals or statistical yearbooks.
- Select Key Countries and Timeframe: Choose 3-5 Latin American countries you are interested in and focus on the 1980-2020 period.
- Extract Gini Coefficient Data: Download or note down the Gini coefficient for your selected countries for key years (e.g., 1980, 1990, 2000, 2010, 2020). If yearly data is available, even better.
- Visualize the Data: Create a simple line graph. The X-axis should represent the years, and the Y-axis should represent the Gini coefficient. Plot a separate line for each country. This visual representation will immediately highlight trends and differences. You can use spreadsheet software like Excel or Google Sheets for this.
- Note Significant Shifts: Observe periods where the Gini coefficient increased or decreased notably. Research historical events (e.g., economic crises, policy changes, commodity booms) that coincided with these shifts. For instance, did a structural adjustment program in the 80s correspond to a rise in the Gini index? Did increased social spending in the 2000s lead to a fall?
- Consider Other Indicators (Optional but Recommended): If available, look at data on poverty rates or income shares for the top 10%. This adds depth to your analysis. The Antropología section of our blog often features articles discussing these broader socio-economic factors.
- Formulate Hypotheses: Based on your visual analysis and historical research, what are your initial conclusions about the drivers of inequality in these specific countries? Consider linking your findings to broader discussions in Sociología and Historia.
This hands-on approach allows for a deeper appreciation of the complexities involved in measuring and understanding socio-economic inequality, echoing the spirit of intellectual exploration that drives our work on Arqueología and historical data.
Conclusion: Towards a More Equitable Future
The period between 1980 and 2020 reveals a persistent challenge of income inequality across Latin America. While some countries have made strides in reducing disparities, the structural factors driving inequality remain deeply entrenched. Addressing this complex issue requires sustained political will, progressive fiscal policies, investments in human capital, and a commitment to inclusive development models.
Understanding the historical context and the interplay of economic, social, and political forces is paramount. As we continue to gather and analyze data, the pursuit of greater equity in Latin America remains a critical goal for fostering stable, just, and prosperous societies. The insights gleaned from studying maps of inequality and historical information are invaluable for navigating these challenges.
Frequently Asked Questions
Q1: Which Latin American country consistently had the highest Gini coefficient between 1980 and 2020?
A1: While rankings fluctuate, countries like Brazil, Colombia, and Honduras have frequently appeared among those with the highest Gini coefficients during this period, indicating significant income inequality.
Q2: Did the commodity boom of the early 2000s significantly reduce inequality in all Latin American countries?
A2: The commodity boom led to some reductions in inequality in several countries due to increased social spending. However, the effects were not uniform, and underlying structural issues meant that gains were often fragile and reversible.
Q3: What is the difference between income inequality and poverty?
A3: Income inequality measures the distribution of income across a population (how spread out incomes are). Poverty refers to the condition of lacking sufficient income or resources to meet basic needs. A country can have high inequality but low poverty, or vice versa, though they are often related.
Q4: Are there reliable DIY methods to track inequality trends?
A4: Yes, by utilizing public data from organizations like the World Bank and CEPAL, one can track Gini coefficients and other indicators over time using spreadsheet software to create visualizations and basic analyses, as outlined in the DIY section.
Q5: How do historical factors contribute to current inequality in Latin America?
A5: Historical factors, such as colonial-era land distribution, social stratification, and the legacy of economic dependency, have created deeply embedded structures that continue to influence wealth and income distribution today.