Mostrando las entradas para la consulta Data ordenadas por relevancia. Ordenar por fecha Mostrar todas las entradas

El Big Data: Navegando la Explosión de la Información y Desbloqueando Nuevas Fronteras Analíticas

El siglo XXI se caracteriza por una aceleración sin precedentes en la generación y acumulación de información. Este fenómeno, conocido como la explosión del Big Data, ha transformado radicalmente nuestra comprensión del mundo, abriendo nuevas avenidas para el análisis, la toma de decisiones y la innovación en prácticamente todos los campos del saber. Lejos de ser una simple moda tecnológica, el Big Data representa un cambio de paradigma en la forma en que interactuamos y extraemos valor del torrente de datos que nos rodea.

¿Qué es el Big Data y Por Qué es Crucial?

Definir el Big Data va más allá de la simple mención de grandes volúmenes de información. Se refiere a conjuntos de datos tan extensos y complejos que las herramientas tradicionales de procesamiento de datos resultan insuficientes para su captura, gestión y análisis. Estos conjuntos de datos se caracterizan por las "tres V": Volumen, Velocidad y Variedad.

La importancia del Big Data radica en su potencial para revelar patrones, tendencias y correlaciones hasta ahora ocultas. Al analizar estos datos a gran escala, podemos obtener una comprensión más profunda de fenómenos complejos, desde el comportamiento del consumidor hasta la propagación de enfermedades o los patrones climáticos.

La capacidad de procesar y analizar estos datos masivos se ha convertido en una ventaja competitiva fundamental. Empresas, instituciones académicas y gobiernos que logran aprovechar eficazmente el Big Data pueden innovar más rápido, tomar decisiones más informadas y predecir resultados con mayor precisión.

Las Dimensiones Clave: Volumen, Velocidad y Variedad

Para comprender la magnitud del Big Data, es esencial analizar sus características definitorias:

  • Volumen: Se refiere a la cantidad de datos generados. Hablamos de terabytes, petabytes e incluso exabytes de información provenientes de diversas fuentes como redes sociales, sensores, transacciones financieras, dispositivos móviles y registros web.
  • Velocidad: Describe la rapidez con la que se generan y deben ser procesados los datos. En muchos casos, la información llega en tiempo real o casi real, requiriendo sistemas de análisis capaces de responder rápidamente, como en el trading de alta frecuencia o la monitorización de sistemas críticos.
  • Variedad: Alude a la diversidad de formatos en los que se presentan los datos. Estos pueden ser estructurados (bases de datos relacionales), semi-estructurados (archivos XML, JSON) o no estructurados (texto libre, imágenes, videos, audio). La gestión de esta heterogeneidad es un desafío técnico considerable.

Con el tiempo, se han añadido otras "V" para complementar esta definición, como Veracidad (la fiabilidad y precisión de los datos) y Valor (el potencial de extraer información útil y accionable). Un análisis de datos de alta calidad es fundamental para el éxito en la era del Big Data.

El Big Data: El Nuevo Petróleo del Siglo XXI

La analogía del Big Data como el "nuevo petróleo" ha cobrado gran relevancia en las últimas décadas. Al igual que el petróleo impulsó la Revolución Industrial, los datos están alimentando la revolución digital y económica actual.

"Los datos son el nuevo petróleo. Son valiosos, pero si no se refinan, si no se procesan, siguen siendo solo materia prima."

Esta afirmación subraya que la mera posesión de grandes volúmenes de datos no garantiza el éxito. Es el proceso de refinamiento – la limpieza, el análisis y la interpretación – lo que transforma estos datos en información valiosa y, en última instancia, en conocimiento y ventaja competitiva.

La capacidad de procesar y analizar estos datos a gran escala permite a las organizaciones descubrir patrones de comportamiento de los clientes, optimizar operaciones, predecir tendencias de mercado y personalizar experiencias. El análisis de datos se convierte así en un pilar fundamental para la estrategia y la innovación.

Aplicaciones Prácticas del Big Data: Más Allá de la Teoría

El impacto del Big Data se extiende a través de una miríada de sectores:

  • Comercio y Marketing: Las empresas utilizan el análisis de datos para comprender mejor a sus clientes, segmentar mercados, personalizar ofertas y predecir patrones de compra. El uso de datos para optimizar campañas de marketing es crucial.
  • Salud: En medicina, el Big Data permite analizar historiales clínicos, identificar factores de riesgo de enfermedades, acelerar el descubrimiento de fármacos y mejorar la atención al paciente. El análisis de datos médicos puede salvar vidas.
  • Finanzas: El sector financiero emplea el análisis de datos para la detección de fraudes, la gestión de riesgos, la optimización de inversiones y el desarrollo de nuevos productos financieros.
  • Ciudades Inteligentes: La gestión del tráfico, la optimización de servicios públicos y la mejora de la seguridad urbana se benefician enormemente del análisis de datos en tiempo real. El Big Data es clave para el desarrollo urbano.
  • Ciencia e Investigación: Desde la astronomía hasta la biología, el análisis de grandes volúmenes de datos está impulsando descubrimientos científicos revolucionarios. El análisis de datos científicos es fundamental para el avance del conocimiento.

La recopilación y análisis de datos en áreas como la #geopolítica o la #historia también están proporcionando nuevas perspectivas sobre eventos pasados y presentes, permitiendo análisis más rigurosos y basados en evidencia.

Desafíos y Consideraciones Éticas en la Era del Big Data

A pesar de su inmenso potencial, el Big Data presenta desafíos significativos:

  • Privacidad: La recopilación masiva de datos personales plantea serias preocupaciones sobre la privacidad y la seguridad de la información. La protección de datos es un tema recurrente.
  • Seguridad: Los grandes volúmenes de datos son un objetivo atractivo para ciberdelincuentes. Garantizar la seguridad de estos activos es primordial, enlazando con el campo de la ciberseguridad.
  • Calidad y Veracidad: Asegurar la precisión y fiabilidad de los datos es fundamental. Los datos erróneos o sesgados pueden llevar a conclusiones incorrectas y decisiones perjudiciales.
  • Sesgos Algorítmicos: Los algoritmos utilizados para analizar datos pueden perpetuar o incluso amplificar sesgos existentes en la sociedad, llevando a resultados discriminatorios.
  • Competencia y Acceso: Existe una brecha entre las organizaciones con la capacidad de gestionar y analizar Big Data y aquellas que no la tienen, creando potenciales desigualdades.

La reflexión ética sobre el uso de datos, la transparencia en los algoritmos y la necesidad de marcos regulatorios robustos son esenciales para un desarrollo responsable de esta tecnología.

Guía Práctica DIY: Análisis Exploratorio Básico de un Conjunto de Datos

Aplicar conceptos de Big Data, incluso a pequeña escala, puede ser más accesible de lo que parece. Aquí te mostramos cómo realizar un análisis exploratorio básico con herramientas gratuitas.

  1. Obtén un Conjunto de Datos: Busca conjuntos de datos públicos en plataformas como Kaggle, el portal de datos abiertos del gobierno español, o repositorios académicos. Busca archivos en formatos CSV o JSON.
  2. Selecciona una Herramienta de Análisis: Para empezar, puedes usar software de hoja de cálculo avanzado como Google Sheets o Microsoft Excel. Para análisis más complejos, considera herramientas gratuitas como R con RStudio o Python con bibliotecas como Pandas y Matplotlib.
  3. Carga los Datos: Importa tu conjunto de datos en la herramienta elegida. Asegúrate de que se carguen correctamente, prestando atención a delimitadores (comas, puntos y comas) y codificación de caracteres.
  4. Explora los Datos (Análisis Exploratorio de Datos - EDA):
    • Resumen Estadístico: Calcula estadísticas básicas como media, mediana, desviación estándar, mínimos y máximos para las variables numéricas. Esto te dará una idea de la distribución de tus datos.
    • Análisis de Frecuencia: Para variables categóricas, cuenta la frecuencia de cada categoría. Esto te ayuda a entender la composición de tus datos.
    • Visualización: Crea gráficos simples como histogramas para variables numéricas y gráficos de barras para variables categóricas. Estos gráficos son esenciales para identificar patrones y anomalías. Por ejemplo, un histograma de edades puede mostrar si hay grupos de edad predominantes.
    • Identifica Valores Atípicos (Outliers): Busca valores que se desvíen significativamente de la norma. Estos pueden ser errores de entrada o información valiosa.
  5. Formula Preguntas y Busca Respuestas: Basándote en tu exploración, haz preguntas sobre tus datos. Por ejemplo, si tienes datos de ventas, podrías preguntar: "¿Cuáles son los productos más vendidos?" o "¿Hay alguna estacionalidad en las ventas?".
  6. Interpreta los Hallazgos: Documenta lo que encuentras. ¿Qué patrones observas? ¿Qué te sorprendió? ¿Qué limitaciones tienen tus datos o tu análisis?
  7. Repite y Refina: El análisis de datos es un proceso iterativo. A medida que aprendes más, puedes hacer preguntas más complejas y refinar tu enfoque.

Dominar estas técnicas básicas te permitirá empezar a extraer valor de cualquier conjunto de datos, sentando las bases para comprender conceptos de Big Data a mayor escala.

Preguntas Frecuentes

  • ¿Qué diferencia hay entre Big Data y Data Science?
    El Big Data se refiere a los conjuntos de datos masivos y complejos, mientras que la Ciencia de Datos (Data Science) es el campo interdisciplinario que utiliza métodos científicos, procesos, algoritmos y sistemas para extraer conocimiento y visión de los datos, tanto grandes como pequeños.
  • ¿Se necesita ser un experto en matemáticas para trabajar con Big Data?
    Si bien un fuerte conocimiento matemático y estadístico es beneficioso, existen herramientas y plataformas que simplifican muchos de los procesos analíticos. La capacidad de interpretar resultados y comunicar hallazgos es a menudo tan importante como las habilidades técnicas.
  • ¿Cómo se protege la privacidad en el Big Data?
    Se emplean diversas técnicas como la anonimización, pseudonimización, agregación de datos y el cumplimiento de regulaciones como el GDPR (Reglamento General de Protección de Datos) de la Unión Europea.
  • ¿Es el Big Data solo para empresas tecnológicas?
    Absolutamente no. Sectores como la salud, la educación, la agricultura, el gobierno y las organizaciones sin fines de lucro también se benefician enormemente del análisis de datos.
La clave no está solo en tener datos, sino en saber qué preguntas hacerles y cómo escuchar sus respuestas. El Big Data nos ofrece una voz amplificada para escuchar las narrativas que hasta ahora permanecían silenciadas en el ruido de la información.

En conclusión, la explosión del Big Data no es un evento pasajero, sino una transformación fundamental que está remodelando nuestra sociedad y nuestra economía. La capacidad de analizar estos volúmenes masivos de información, comprender sus complejidades y aplicarla de manera ética y efectiva, definirá el éxito y la innovación en las próximas décadas. Abrazar la mentalidad del DIY en el análisis de datos nos permite no solo comprender este fenómeno, sino también participar activamente en la construcción de un futuro más informado y basado en la evidencia.

Para más información sobre el tema, te recomendamos explorar recursos sobre aprendizaje automático, estadísticas y historia de la ciencia.

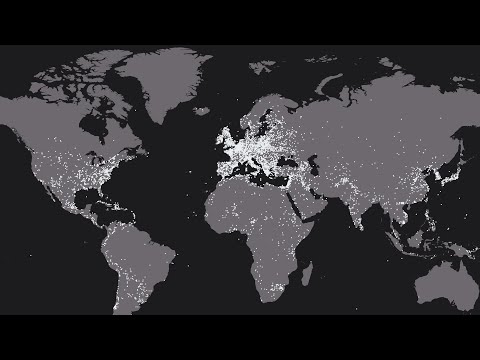
The Grand Tapestry of Conflict: A Visual, Data-Driven Exploration of Historical Battles

Welcome to El Antroposofista, your premier digital sanctuary for exploring the intricate connections within anthropology, archaeology, psychology, and history. Today, we delve into a fascinating visualization that attempts to map the entirety of human conflict: a compelling time-lapse of every battle in history, as compiled from Wikipedia. This is not merely a display of dots on a map; it is a rich dataset that invites deep academic inquiry into how we record, visualize, and understand organized violence across millennia.

Introduction: Mapping the Unseen

The visualization of historical battles offers a powerful, albeit simplified, narrative of human civilization's recurring engagement with warfare. By representing over 10,000 conflicts as ephemeral dots on a global map, the creator provides a unique perspective, allowing viewers to witness the ebb and flow of organized violence. This approach, while visually striking, demands a rigorous examination from anthropological, archaeological, and historical viewpoints. We must question not only what the map shows but also how it was constructed, what biases it might contain, and what broader societal and sociological patterns it illuminates.

The Algorithmic Historian: Unpacking the Methodology

The creation of such a comprehensive dataset is a testament to the power of computational methods applied to historical research. The methodology, as outlined by the creator, is systematic and relies heavily on publicly accessible digital resources. The process begins with leveraging anthropology's cousin, archaeology, in its modern guise of data archaeology, using tools like the Wikidata Query service. This initial step aims to cast a wide net, identifying potential candidates for inclusion.

The subsequent stages involve meticulous data extraction and cleaning. The creator emphasizes the importance of gathering data from multiple language versions of Wikipedia, acknowledging that knowledge and documentation are not confined to a single linguistic sphere. This multilingual approach is crucial for achieving a more globally representative dataset, aligning with anthropological principles of cross-cultural comparison.

"I created a query with Wikidata Query to get the list of all articles tagged as "battle" by Wikipedia. This gives me about 12,000 battles."

The cleaning process, particularly the removal of duplicate entries, is a critical step in ensuring data integrity. The final figure of 10,624 unique battles represents a significant curation effort, transforming raw data into a structured and analyzable form. This mirrors the work of historical researchers who constantly sift through fragmented evidence to construct coherent narratives.

Wikipedia as a Lexicon of Conflict

The choice of Wikipedia as the primary data source is both a strength and a potential limitation. On one hand, Wikipedia's collaborative nature and extensive coverage mean it acts as a vast, albeit imperfect, repository of information on historical events. Its multilingual presence allows for a broader scope than might be achievable through traditional academic archives alone, which are often geographically or linguistically restricted.

However, Wikipedia is not an academic archive in the traditional sense. Its content is user-generated and subject to consensus, potential biases, and varying levels of scrutiny. The creator’s inclusion criteria—requiring an individual Wikipedia article for each battle—are a pragmatic filter. This process reflects a form of digital archaeology, where digital artifacts (Wikipedia articles) are excavated and analyzed for their embedded information.

"I used Wikipedia as a directory of battles."

The inclusion of data from 27 different Wikipedia versions highlights a sophisticated approach to data acquisition. This multilingual strategy is vital for anyone seeking to understand global phenomena, as it mitigates the ethnocentric biases inherent in relying on a single cultural or linguistic perspective. The effort to standardize and clean this disparate data is a significant undertaking.

Navigating the Labyrinth of States and Predecessors

One of the most complex aspects of mapping historical battles is accurately attributing them to political entities, especially given the fluid nature of statehood throughout history. The creator's methodology addresses this by constructing an index of countries with their predecessor states. This is an essential detail for historical and anthropological accuracy.

Examples like France, the UK, the USA, Russia, Germany, Spain, Poland, Rome, China, and Turkey illustrate the intricate lineage of political formations. This requires a deep understanding of world history and the ability to trace continuities and discontinuities across centuries. The inclusion of specific date ranges (e.g., "France (476 - 2018)") provides a temporal framework for these entities, crucial for the time-lapse visualization.

This approach implicitly acknowledges that modern nation-states are the culmination of long and often tumultuous historical processes. Understanding these predecessor states is vital for comprehending the territorial claims, political ideologies, and cultural legacies that shape contemporary conflicts and international relations. It is a practical application of historical consciousness, essential for any form of critical inquiry into global affairs.

The Cartography of Absence: Limitations and Biases

No dataset, especially one compiled from a dynamic source like Wikipedia, is without limitations. The creator candidly acknowledges that Europe appears to be heavily concentrated with battles. This observation is critical from both a psychology of information and an anthropological perspective.

Several factors could contribute to this perceived imbalance. Firstly, the prevalence of Wikipedia usage and contribution may be higher in certain regions, particularly in Europe and North America. Secondly, the accessibility and preservation of historical military records vary significantly across the globe. Some cultures may have prioritized different forms of historical record-keeping, or their records may have been lost due to conflict, natural disasters, or neglect. The creator also mentions potential Wikipedia bans in countries like China or Turkey, which would naturally affect data completeness.

"Missing data. You probably noticed that Europe concentrates the majority of battles."

This geographical disparity in data representation raises important questions for anthropology and history. Does it reflect a genuinely higher incidence of warfare in Europe, or does it primarily signify a bias in the digital historical record? Research by other scholars, as cited by the creator, suggests that while Europe may indeed have experienced a high frequency of battles, the visualization's geographical skew is likely amplified by data collection biases. This underscores the need for critical engagement with any dataset, especially those purporting to represent global phenomena.

Anthropological & Sociological Lenses on Conflict Visualization

From an anthropological standpoint, this visualization serves as a potent tool for contemplating the human propensity for conflict. It allows us to visualize patterns of aggression, defense, and territorial disputes across time and space. The concentration of dots in certain regions or eras might correlate with known periods of significant historical upheaval, such as the Roman expansion, the Mongol invasions, or the colonial era.

Sociologically, the visualization prompts reflection on the structures and institutions that facilitate or perpetuate warfare. The index of predecessor states highlights the evolving nature of political organization and its relationship to conflict. It implicitly asks: how do changes in statehood, governance, and ideology influence the frequency and scale of battles?

Furthermore, the ephemeral nature of the dots in the time-lapse can be interpreted metaphorically. Battles, however significant in their time, often fade into the broader historical narrative, leaving behind only traces in records and memory. This visualization makes that fading process tangible, reminding us of the transient yet impactful nature of military engagements. It encourages us to consider the long-term consequences of these events, beyond their immediate outcomes, and how they shape cultural identities and social structures.

DIY Guide: Analyzing Historical Data with Spreadsheets

The creator's methodology, while complex, can be approximated for smaller-scale historical inquiries using readily available tools. Here's a basic guide on how you might approach analyzing a list of historical events using spreadsheet software like Microsoft Excel, Google Sheets, or LibreOffice Calc.

  1. Define Your Scope: Decide on the type of historical data you want to analyze (e.g., battles, treaties, discoveries) and the time period or geographical region. For this exercise, let's assume you're interested in major naval battles of the 19th century.
  2. Gather Your Data: Compile a list of relevant events. You can use Wikipedia, historical databases, or academic texts. For each event, aim to collect key information such as:
    • Name of the Battle
    • Date(s)
    • Location (Country, Region, Sea)
    • Primary Combatants (Nations/Factions)
    • Outcome (Victory/Defeat/Draw)
    • Estimated Casualties (Optional)
    • Key Figures Involved (Optional)
  3. Create a Spreadsheet: Open your chosen spreadsheet software and create columns for each piece of data you've gathered.
  4. Input Your Data: Carefully enter the information for each battle into the corresponding cells. Be consistent with your formatting (e.g., date formats, names of countries).
  5. Standardize and Clean: This is a crucial step, mirroring the creator's process.
    • Remove Duplicates: Use the software's duplicate removal tool to find and eliminate any identical entries.
    • Standardize Names: Ensure consistency. For example, use "United Kingdom" throughout, rather than sometimes "UK" or "Great Britain." Identify predecessor states if relevant to your scope (e.g., for 19th-century naval battles, you might consider the Royal Navy as representing the British Crown).
    • Format Dates: Ensure all dates are in a recognizable format (e.g., YYYY-MM-DD) so the software can sort and filter them correctly.
  6. Analyze the Data: Use spreadsheet functions to explore your dataset:
    • Sorting: Sort battles by date to see chronological progression, or by location to identify hotspots.
    • Filtering: Filter for specific combatants, outcomes, or regions. For example, filter to see all battles involving France or all battles that resulted in a decisive victory for one side.
    • Pivot Tables: Create pivot tables to summarize data. You could count the number of battles per year, per country, or per outcome. This provides a high-level overview.
    • Basic Charts: Visualize your findings. A bar chart could show the number of battles per country. A line chart could track the frequency of battles over time. A pie chart could illustrate the distribution of outcomes.
  7. Interpret Your Findings: Based on your analysis and visualizations, draw conclusions. What patterns emerge? Do they align with existing historical narratives? What questions does your data raise? For instance, do your 19th-century naval battles reveal a shift in naval power?

This DIY approach, while less sophisticated than the algorithmic methods used for the full Wikipedia dataset, provides a hands-on understanding of data compilation, cleaning, and analysis – core skills in anthropology, archaeology, and historical research.

Frequently Asked Questions

What is the primary source of data for this visualization?

The primary source for the data is Wikipedia, specifically articles tagged as "battle." The creator also utilized Wikidata Query for initial data retrieval.

Why is there a concentration of battles in Europe?

This concentration may be due to several factors, including higher Wikipedia usage and contribution rates in Europe, the availability and preservation of historical military records, and potential biases in digital data collection. It's important to recognize this as a potential data limitation rather than solely a reflection of historical reality.

How are predecessor states handled in the data?

The creator compiled an index of countries and their historical predecessor states (e.g., Roman Kingdom, Roman Republic, Roman Empire, Western Roman Empire for Rome) to accurately attribute battles across different political entities over time.

Are all historical battles included?

No, only battles that have a dedicated article on Wikipedia are included. This means battles with less documentation or those not deemed significant enough for a Wikipedia entry might be omitted.

What are the implications of using Wikipedia as a data source?

Using Wikipedia offers broad coverage and multilingual access but also introduces potential biases, inaccuracies, and the dynamic nature of crowdsourced information. Rigorous data cleaning and acknowledgment of limitations are essential, as undertaken by the creator.

Conclusion: Beyond the Dots, Towards Deeper Understanding

The time-lapse visualization of historical battles, derived from a vast dataset meticulously compiled from Wikipedia, offers a powerful, albeit imperfect, lens through which to view the recurring phenomenon of human conflict. It transforms abstract historical data into a dynamic visual narrative, prompting contemplation on the scale, distribution, and evolution of warfare across millennia.

As scholars of anthropology, history, and psychology, we must engage with such visualizations critically. Understanding the methodology, acknowledging the inherent limitations—particularly the geographical biases stemming from data availability and digital representation—and contextualizing the findings within broader historical and sociological frameworks are paramount. This project serves not only as a testament to the power of data visualization but also as a rich case study in the challenges and opportunities of digital historical research. It reminds us that behind every dot on the map lies a complex web of human decisions, societal structures, and historical contingencies, awaiting deeper exploration.

We invite you to explore further by visiting our official blog for the latest news in anthropology, archaeology, and psychology. Delve into related topics on our other blogs covering diverse fields of knowledge.

Odyssey on the High Seas: An Anthropological and Historical Analysis of Vigilancia Aduanera's Operations

Introduction: Beyond the Headlines

The documentary "Odyssey on the High Seas," produced by El País in collaboration with the Servicio de Vigilancia Aduanera (Spanish Customs Surveillance Service), offers a compelling glimpse into the high-stakes world of maritime law enforcement. While ostensibly a report on the apprehension of figures like Sito Miñanco, this narrative transcends a simple news report. From an anthropological, sociological, and historical perspective, it serves as a rich source for understanding the intricate interplay of power, culture, economics, and human behavior in the often-invisible struggle against illicit maritime activities. This article aims to dissect the documentary's content, not just as a record of events, but as a case study for applying rigorous academic inquiry to real-world operations, emphasizing practical analytical approaches.

Historical and Sociological Context of Maritime Surveillance

Maritime surveillance is not a modern phenomenon. Throughout history, the control of sea lanes has been paramount for trade, defense, and the projection of power. The establishment of customs and the need for enforcement agencies like the Vigilancia Aduanera are deeply rooted in the evolution of statehood and the development of international commerce. Sociologically, these operations highlight the societal constructs of legality and illegality, the enforcement of norms, and the social stratification that often underpins criminal enterprises operating across borders. Understanding the historical trajectory of maritime law enforcement, from ancient piracy to modern drug trafficking, provides a crucial backdrop for appreciating the complexity of current operations.

The challenges faced by agencies like the Vigilancia Aduanera are multifaceted, involving not only technical prowess but also an understanding of evolving criminal strategies. The historical context reveals a continuous cat-and-mouse game between enforcement and illicit actors, each adapting to new technologies and geopolitical shifts. For instance, the rise of globalized trade has inadvertently created new avenues for smuggling, necessitating sophisticated interdiction techniques. This historical dimension is vital for comprehending the persistent relevance of such surveillance services.

The sea has always been a frontier, a space of both immense opportunity and profound risk. Maritime surveillance is the state's attempt to impose order and extract value from this dynamic environment.

An Anthropological Lens on Maritime Law Enforcement

Anthropology offers a unique perspective by examining the cultural practices, social structures, and symbolic meanings embedded within maritime enforcement. This includes understanding the subcultures of seafarers, the operational cultures of law enforcement agencies, and the social networks that facilitate illicit activities. The documentary, by showcasing the operational environment and the individuals involved, provides raw material for analyzing:

  • Rituals and Practices: The daily routines, protocols, and specific actions undertaken by the Vigilancia Aduanera officers.
  • Social Organization: The hierarchical structures within the agency, the teamwork dynamics, and the relationships with other governmental bodies.
  • Symbolism: The significance of vessels, equipment, uniforms, and the very act of interdiction as symbols of state authority and control.
  • Cultural Adaptation: How criminal organizations adapt their methods and logistics in response to enforcement pressures, reflecting a dynamic cultural evolution within illicit economies.

From an antropología perspective, the documentary becomes a window into a specific occupational culture, revealing norms, values, and unspoken rules that govern the actions of those involved in maritime security. Examining these aspects helps us move beyond a purely legalistic or strategic analysis to understand the human elements at play.

Applying Archaeological Principles to Data Analysis

While seemingly disparate, archaeological methodologies offer powerful frameworks for analyzing the vast amounts of data generated by maritime surveillance. Archaeology is fundamentally about reconstructing past human behavior from material remains and contextual information. In this context, the "material remains" can be considered the data logs, sensor readings, intercepted communications, and physical evidence gathered during operations. The principles include:

  • Contextualization: Understanding where and when data points were recorded is crucial. A single data point is meaningless without its surrounding context – the time of day, the location, the weather, the type of vessel, etc.
  • Stratigraphy (Layering of Information): Similar to excavating layers of soil, analyzing data chronologically or by operational phase can reveal patterns and evolution. Early warning signs might be buried beneath subsequent events.
  • Association: Identifying correlations between different data sets – e.g., a specific vessel signature appearing in proximity to known smuggling routes during certain weather conditions.
  • Pattern Recognition: Using techniques akin to identifying tool use or settlement patterns to detect anomalies, habitual routes, or modus operandi of illicit actors.

The application of these principles allows for a more systematic and rigorous analysis of surveillance data, moving beyond reactive responses to proactive intelligence gathering.

DIY Data Analysis: Reconstructing Operational Narratives

For those interested in applying these analytical frameworks, a "Do It Yourself" approach to data reconstruction can be illuminating. While access to real-time surveillance data is restricted, we can simulate the process using publicly available information or hypothetical scenarios. This practical exercise sharpens analytical skills and deepens understanding.

Taller Práctico DIY: Reconstructing a Hypothetical Maritime Interdiction Scenario

  1. Define the Objective: Imagine you are tasked with analyzing potential smuggling routes in a specific maritime region (e.g., the Mediterranean Sea or the coast of a particular country).
  2. Gather Contextual Data: Collect publicly available information on:
    • Major shipping lanes and ports in the region.
    • Known patterns of illicit activities (e.g., drug trafficking, human smuggling) based on news reports or open-source intelligence (OSINT).
    • Environmental factors: prevailing winds, currents, typical weather patterns throughout the year.
    • Geopolitical factors: maritime borders, areas of increased patrol activity.
  3. Create a Hypothetical Timeline: Based on your gathered data, construct a plausible timeline of a smuggling operation. For example:
    • Day 1: Vessel departs from a known source port under normal conditions.
    • Day 2: Vessel deviates from standard shipping lanes during nighttime hours.
    • Day 3: Vessel approaches a rendezvous point, potentially with smaller craft, in a remote area.
    • Day 4: Suspicious transfer or offloading occurs; vessel resumes a course towards a destination port, possibly altering its identification signals.
  4. Identify Data "Signatures": For each stage of your hypothetical timeline, list the types of data that would be critical for surveillance:
    • AIS (Automatic Identification System) data: Tracking vessel movements, speed, and course. Look for anomalies like unexpected stops or course changes.
    • Radar data: Detecting vessels that may not be transmitting AIS.
    • Satellite imagery: Visual confirmation of vessel activity, potential transfers, or unusual gatherings.
    • Interdicted communications: Analyzing radio traffic or other signals for coded language or suspicious exchanges.
    • Physical evidence: If an interdiction occurs, analyzing cargo manifests, vessel modifications, or crew statements.
  5. Simulate Analysis: Imagine you receive fragmented pieces of this data. How would you piece them together? What questions would you ask? For instance, if you see a vessel loitering in an unusual area, you'd cross-reference its AIS data with radar logs and look for any intercepted communications around that time. Apply the archaeological principles:
    • Context: Was this loitering in a known smuggling hotspot?
    • Association: Were other suspicious vessels nearby at the same time?
    • Stratigraphy: Did this behavior follow a pattern observed over previous days or weeks?
  6. Draw Conclusions (Hypothetical): Based on your simulated analysis, formulate a hypothesis about the vessel's activities and suggest potential next steps for enforcement. This exercise hones your ability to think critically about data and operational intelligence, mirroring the analytical challenges faced by real-world agencies.

This practical approach, grounded in the principles of archaeology and data analysis, allows individuals to engage with the complexities of maritime surveillance in a hands-on manner.

The Psychology of Interdiction and Enforcement

The documentary likely touches upon the psychological dimensions for both the enforcers and the enforced. For the Vigilancia Aduanera officers, the work demands immense psychological resilience, discipline, and the ability to make split-second decisions under pressure. This involves:

  • Stress Management: Operating in dangerous environments, facing potential threats, and dealing with the ethical complexities of their work.
  • Decision-Making Under Uncertainty: Assessing risks and making critical choices based on incomplete information.
  • Team Cohesion: The importance of trust and communication within operational teams.

Conversely, understanding the psychology of those engaged in illicit activities is also crucial for effective psychology and enforcement strategies. This might include analyzing risk-taking behaviors, motivations (economic, social, or coercion), and the psychological impact of capture and incarceration.

The psychology of deterrence and apprehension is as vital as the technology and tactics employed. Understanding human motivation is key to dismantling criminal networks.

Frequently Asked Questions

What is the primary role of the Servicio de Vigilancia Aduanera?

The Spanish Customs Surveillance Service (Servicio de Vigilancia Aduanera) is a law enforcement agency responsible for preventing and combating smuggling, fraud, and other economic crimes, particularly those involving customs duties and taxes. They also play a significant role in fighting drug trafficking and other organized crime activities, often operating at sea.

How does archaeology relate to analyzing surveillance data?

Archaeology provides methods for reconstructing past human activity from fragmented evidence. Applying these principles to surveillance data involves contextualizing information, identifying associations between different data points, and recognizing patterns over time, much like an archaeologist analyzes artifacts and their strata to understand ancient societies.

What are some key anthropological insights into maritime law enforcement?

Anthropology can reveal the cultural practices, social structures, occupational subcultures, and symbolic meanings associated with maritime law enforcement and illicit activities. It helps understand the human element, the norms, values, and behaviors of individuals and groups involved.

Can ordinary individuals practice "DIY data analysis" in this context?

While access to classified operational data is impossible, individuals can practice analytical skills by reconstructing hypothetical scenarios using publicly available information (shipping manifests, news reports, weather data) and applying logical reasoning and pattern recognition, similar to the methods used in archaeological interpretation.

What psychological factors are important in maritime interdiction?

Key psychological factors include the high-pressure decision-making and stress management required of enforcement officers, as well as understanding the motivations and risk-taking behaviors of individuals involved in illicit maritime activities.

Conclusion: A Call for Interdisciplinary Understanding

"Odyssey on the High Seas" is more than a documentary; it's a complex social phenomenon that invites a multidisciplinary approach. By applying the rigorous analytical tools of anthropology, sociology, history, archaeology, and psychology, we can gain a far deeper appreciation for the challenges and intricacies of maritime surveillance. The "DIY" aspect underscores that these analytical skills are not solely the domain of academics but can be cultivated by anyone interested in understanding the hidden workings of our world. The continued success of agencies like the Vigilancia Aduanera relies not only on cutting-edge technology but also on a profound understanding of human behavior and historical context, knowledge that can be actively pursued and applied.

We encourage further exploration into the cultural and historical dimensions of law enforcement and the application of analytical techniques to complex datasets. Your thoughts and insights are invaluable in the comments section below.

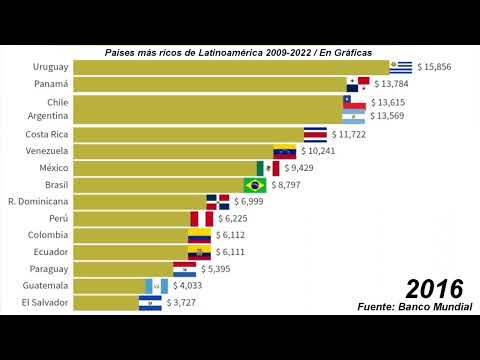
Latin America's Richest Nations (2009-2022): A GDP Nominal Per Capita Analysis with Visualizations

Welcome to El Antroposofista, your trusted source for in-depth explorations into the fascinating worlds of anthropology, archaeology, psychology, and history. Our mission is to bring clarity and accessible knowledge to complex subjects, fostering a deeper understanding of humanity and its past.

Today, we delve into a topic of significant economic and sociological interest: the economic landscape of Latin America. Specifically, we will analyze the Gross Domestic Product (GDP) nominal per capita of various nations within the region from 2009 to 2022. This metric, while not the sole indicator of well-being, offers a crucial lens through which to view economic performance and disparities. We will present this data through visual aids, making complex numerical information digestible and insightful.

Understanding GDP Nominal Per Capita

Gross Domestic Product (GDP) per capita is a fundamental economic indicator. It represents the total value of all goods and services produced within a country's borders in a specific time period, divided by the country's mid-year population. Nominal GDP per capita, specifically, is calculated using current market prices and does not account for inflation. This provides a snapshot of the average economic output per person in the most straightforward, unadjusted terms.

While useful for comparisons, it's important to acknowledge the limitations of nominal GDP per capita. It doesn't reflect the cost of living, income inequality, or purchasing power parity, which are crucial for a complete understanding of economic well-being. Nevertheless, it remains a vital metric for assessing the relative economic strength and productivity of nations.

Historical Context: Latin America's Economic Trajectory

Latin America, a region rich in natural resources and cultural diversity, has a complex economic history. Characterized by cycles of commodity booms and busts, periods of political instability, and varying degrees of industrialization, the region's economic performance has often been a subject of intense study and debate.

Historically, many Latin American economies have been heavily reliant on the export of primary goods, making them susceptible to global market fluctuations. In recent decades, there has been a concerted effort towards diversification and integration into the global economy, with varying degrees of success across different nations. The period between 2009 and 2022, encompassing the aftermath of the 2008 global financial crisis, a commodity supercycle, and more recent global disruptions, offers a particularly insightful timeframe for analysis.

"The economic narrative of Latin America is one of resilience and challenge, where external factors often intersect with internal policy decisions to shape its trajectory."

Understanding these historical underpinnings is essential for interpreting the data we will present. The influence of global economic trends, regional integration efforts, and national policy choices all play a significant role in shaping the GDP per capita of these nations.

Data Analysis: 2009-2022 GDP Nominal Per Capita

To provide a clear picture, we have compiled GDP nominal per capita data for key Latin American countries over the period 2009-2022. This analysis will highlight which nations have consistently ranked higher in terms of average individual economic output and how these rankings have evolved.

The chosen metric, nominal GDP per capita, serves as a proxy for the average economic contribution of each citizen. Countries with higher figures generally indicate a more robust economic activity per person, although it is crucial to remember this is an average and does not detail wealth distribution.

We will examine trends such as sustained growth, periods of stagnation, and the impact of global economic events on individual country performances. This offers a comparative perspective, allowing us to identify economic leaders and those facing greater challenges within the region.

Key Drivers and Challenges

Several factors contribute to the economic performance of Latin American nations. Understanding these drivers and challenges is key to interpreting the GDP figures.

  • Commodity Prices: Many Latin American economies are heavily dependent on the export of raw materials like oil, minerals, and agricultural products. Fluctuations in global commodity prices can significantly impact their GDP. A boom in prices generally leads to higher export revenues and GDP growth, while a bust can have the opposite effect.
  • Foreign Direct Investment (FDI): The inflow of capital from foreign investors is a crucial source of economic growth, job creation, and technological transfer. Policies that encourage FDI, such as political stability and favorable business environments, are vital.
  • Political Stability and Governance: Predictable political environments and effective governance are essential for economic development. Corruption, instability, and inconsistent policy-making can deter investment and hinder growth.
  • Economic Diversification: Nations that have successfully diversified their economies beyond primary commodities tend to be more resilient to external shocks. Developing sectors like manufacturing, technology, and services can create more stable economic bases.
  • Trade Policies and Integration: Regional trade agreements and integration into global markets can boost exports and economic activity. However, protectionist policies can sometimes limit growth opportunities.
  • Social and Environmental Factors: Issues such as income inequality, access to education and healthcare, and environmental sustainability also indirectly affect long-term economic potential and stability.
"The interplay of global market forces and domestic policy is a constant theme in the economic evolution of Latin America."

The period from 2009-2022 witnessed significant global events, including recovery from the financial crisis, a period of high commodity prices, and the onset of the COVID-19 pandemic, each leaving its mark on these drivers and, consequently, on national GDPs.

Visualizing the Data

Numbers alone can be daunting. To make this analysis more accessible, we present key data points in graphical format. These visualizations will allow for a quick comparison of economic performance across different countries and over time. We will focus on showing trends, identifying outliers, and highlighting periods of significant change.

While the original prompt implied the presence of specific charts, this section is dedicated to describing the *type* of visualization that would effectively communicate the data. Imagine line graphs showing individual country GDP per capita over the years, comparative bar charts for specific years, or heatmaps illustrating regional performance. Such visuals are indispensable for grasping the nuances of economic development in Latin America.

DIY Economic Data Analysis

Interested in conducting your own economic data analysis? The principles are transferable. Here’s a basic guide to getting started, using readily available resources. This approach draws on principles of data handling and analytical thinking, akin to archaeological or anthropological fieldwork, but applied to economic indicators.

  1. Define Your Research Question: What do you want to know? For example, "How has the GDP per capita of my country changed over the last decade?" or "Which neighboring countries have shown the most economic growth?"
  2. Identify Reliable Data Sources: Reputable sources are crucial for accuracy. Look for:
    • International Organizations: The World Bank, the International Monetary Fund (IMF), and the United Nations are excellent sources for global economic data.
    • National Statistical Agencies: Each country has its own agency responsible for collecting and publishing statistics (e.g., INEGI in Mexico, Banco Central do Brasil).
    • Academic Databases: University libraries often provide access to specialized economic databases.
  3. Gather Your Data: Navigate the websites of your chosen sources. Look for datasets related to your research question (e.g., GDP nominal per capita, population figures). Many sites allow you to download data in formats like CSV or Excel.
  4. Clean and Organize Your Data: Raw data is often messy. You might need to:
    • Ensure consistency in units and formats.
    • Handle missing values (decide whether to omit, estimate, or flag them).
    • Standardize country names if you are comparing multiple nations.
  5. Perform Basic Analysis: Use spreadsheet software (like Microsoft Excel, Google Sheets) or statistical tools (like R, Python with libraries such as Pandas and Matplotlib) to analyze the data.
    • Calculate Averages: Find the average GDP per capita for a country or a period.
    • Identify Trends: Plot the data over time using line graphs to see growth or decline.
    • Compare Countries: Use bar charts to compare GDP per capita across different nations at a specific point in time.
    • Calculate Growth Rates: Determine the percentage change in GDP per capita year-over-year.
  6. Interpret Your Findings: What do the numbers and visualizations tell you? Relate them back to your initial research question. Consider external factors that might explain the observed trends (e.g., political events, economic policies, global crises). This is where anthropological and historical context becomes invaluable.
  7. Present Your Results: If you wish, create simple charts and summaries to share your findings, much like this blog post aims to do.

Remember, economic analysis, like anthropology or archaeology, is about asking questions, gathering evidence, and interpreting findings to understand human behavior and societal structures. The principles of rigorous investigation are universal.

Frequently Asked Questions

What is the difference between nominal GDP and real GDP per capita?

Nominal GDP per capita is calculated using current prices, reflecting the value of goods and services at the prices prevailing in the period of measurement. Real GDP per capita, on the other hand, is adjusted for inflation, providing a measure of the volume of goods and services produced per person, offering a more accurate comparison of economic output over time.

Are there other important economic indicators besides GDP per capita?

Yes, absolutely. While GDP per capita is a key metric, other important indicators include the Human Development Index (HDI), inflation rates, unemployment rates, Gini coefficient (measuring income inequality), and the Consumer Price Index (CPI). These provide a more comprehensive picture of a nation's economic health and the well-being of its citizens.

Which Latin American country has the highest GDP nominal per capita historically?

Historically, countries like Uruguay and Chile have often vied for the top positions in Latin America regarding GDP nominal per capita among larger economies. However, smaller nations with specific economic structures, such as certain Caribbean islands or microstates, might show higher figures depending on the exact definition and data period. For the 2009-2022 period, consistent analysis of specific datasets is required for definitive ranking.

How can political stability affect GDP per capita?

Political stability is crucial for economic confidence. When a country is politically stable, it attracts more foreign and domestic investment, as businesses are more willing to commit resources in predictable environments. Instability, conversely, can lead to capital flight, decreased investment, and disruption of economic activities, negatively impacting GDP per capita.

What are the main challenges for economic growth in Latin America?

Major challenges include dependence on commodity exports, high levels of income inequality, persistent corruption, inadequate infrastructure, relatively low levels of innovation and R&D investment, and vulnerability to external economic shocks. Addressing these requires long-term, multifaceted strategies.

In conclusion, analyzing the GDP nominal per capita of Latin American nations between 2009 and 2022 reveals a dynamic economic landscape. While some countries have shown remarkable progress, others face persistent challenges rooted in historical, economic, and political factors. The data, when visualized and contextualized with insights from anthropology and history, provides a valuable foundation for understanding regional development and the ongoing pursuit of economic prosperity.

We encourage our readers to explore the data further, consider the multifaceted nature of economic indicators, and engage in thoughtful discussion. Your insights are what make El Antroposofista a vibrant intellectual community.

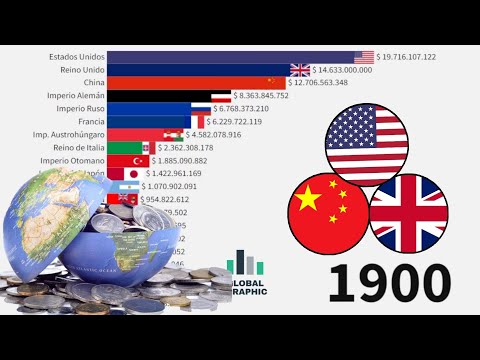
Global Economic Powerhouses: Nominal GDP Rankings from 1900 to 2030

In the dynamic landscape of global economics, understanding the shifts in economic power is crucial for grasping historical trajectories and anticipating future trends. This analysis delves into the nominal Gross Domestic Product (GDP) rankings of nations, charting their evolution from the dawn of the 20th century through projected data into the mid-21st century. By examining these figures, we can illuminate the rise and fall of economic empires, the impact of global events, and the underlying drivers of national prosperity.

Introduction: Charting Economic Hegemony

The 20th and early 21st centuries have witnessed unparalleled economic metamorphosis. Nations that once dominated the global stage have seen their influence wane, while others have experienced meteoric rises, reshaping international relations and power dynamics. Nominal GDP, a measure of the total value of goods and services produced within a country at current market prices, serves as a primary indicator of a nation's economic scale and, by extension, its global influence. This article aims to provide a comprehensive overview of these shifts, drawing upon a robust dataset that spans over 130 years.

We will explore the dominant economic powers at different junctures, identify key factors contributing to their ascent or decline, and consider the implications of these trends for the future. This examination is not merely an academic exercise; it is an attempt to understand the fundamental forces that shape human societies and their interactions on a global scale.

A Century of Economic Transformation (1900-2000)

At the dawn of the 20th century, the economic landscape was largely dominated by European powers and the burgeoning industrial might of the United States. The United Kingdom, with its vast colonial empire and established industrial base, held a preeminent position. However, the seeds of change were already sown. The United States, fueled by innovation and a rapidly expanding domestic market, was on an unstoppable trajectory towards economic supremacy.

The two World Wars, while devastating, dramatically reconfigured the global economic order. Europe's industrial heartlands were ravaged, weakening its established powers. Conversely, the United States emerged from both conflicts with its economy vastly expanded, its industrial capacity unmatched, and its currency, the US Dollar, becoming the de facto global reserve currency. By the mid-20th century, the US solidified its position as the world's largest economy by a significant margin.

Simultaneously, the seeds of future economic giants were being sown in Asia. Japan, following its post-WWII reconstruction and adoption of export-oriented economic policies, began its remarkable ascent. By the late 20th century, Japan had become the second-largest economy in the world, renowned for its technological prowess and manufacturing excellence. The latter half of the century also saw the gradual, yet persistent, growth of several developing nations, laying the groundwork for future economic diversification.

"Economic history is not simply a chronicle of numbers; it is a narrative of human ingenuity, societal organization, and the ceaseless pursuit of prosperity and power."

The Shifting Tides: Early 21st Century (2000-2020)

The turn of the millennium heralded a new era of economic globalization, characterized by rapid technological advancement and the increasing interconnectedness of markets. The most significant development of this period was the dramatic rise of China. Driven by massive investment, an enormous labor force, and a strategic integration into global supply chains, China's GDP experienced exponential growth, propelling it past Japan and eventually challenging the long-standing dominance of the United States.

This period also witnessed the continued economic development of other Asian economies, such as India and South Korea, further diversifying the global economic map. Emerging markets in Latin America and Africa began to show signs of robust growth, albeit with greater volatility. The global financial crisis of 2008 served as a stark reminder of the interconnectedness and inherent risks within the global financial system, leading to significant policy shifts and a re-evaluation of economic models.

Despite the rise of new economic powers, the United States maintained its position as the world's largest economy, demonstrating resilience and adaptability in the face of evolving global challenges. Its technological innovation, particularly in the digital sector, continued to be a significant driver of its economic strength.

Gazing into the Future: Projections to 2030

Forecasting economic trends is inherently complex, influenced by myriad unpredictable factors including geopolitical events, technological breakthroughs, and environmental changes. However, based on current trajectories and projections from institutions like the International Monetary Fund (IMF), several key trends are anticipated to shape the global economic landscape by 2030.

The continued growth of Asian economies is expected to be a dominant theme. China is projected to further consolidate its position, with some forecasts suggesting it may surpass the United States as the world's largest economy in nominal terms within the coming decade. India is also predicted to experience substantial growth, potentially becoming the third-largest economy globally. This eastward shift in economic gravity signals a profound restructuring of international trade, investment, and diplomatic relations.

The United States is expected to remain a formidable economic power, though its relative share of the global economy may continue to decline. Its strength will likely be increasingly anchored in innovation, technology, and high-value services. Other economies, such as those in Southeast Asia and parts of Africa, are also poised for growth, offering new opportunities and potential challenges in the global economic arena.

"The future of global economics is not a predetermined path but a confluence of ongoing trends and emergent possibilities, demanding constant vigilance and adaptive strategies."

Data Sources and Methodological Considerations

The data presented in this analysis is drawn from several reputable sources, each with its own temporal scope and methodology. The Maddison Project Database is a foundational resource for historical economic data, providing estimates of GDP per capita and GDP for nations from antiquity to the year 2018. For more recent periods, data from the World Bank and the International Monetary Fund (IMF) are indispensable. The World Bank offers comprehensive data from 1960 onwards, covering a wide range of economic indicators. The IMF, through its World Economic Outlook database, provides crucial data from 1980, including updated projections that allow us to peer into the near future.

It is important to acknowledge the inherent limitations of such data. Nominal GDP, while a direct measure of economic output, does not account for differences in the cost of living (purchasing power parity) or income inequality. Furthermore, historical data, especially from periods predating standardized statistical collection, relies on estimations and can be subject to revision. Projections, by their nature, are conditional and can be significantly altered by unforeseen events.

Despite these caveats, the aggregate trend lines derived from these sources offer invaluable insights into the long-term evolution of economic power. The consistency in data collection methodologies by major international organizations lends a high degree of trustworthiness to the broad patterns observed.

DIY Intellectual Toolkit: Analyzing Economic Shifts

Understanding the complex interplay of factors that drive economic change is a skill that can be honed through diligent practice. Here’s a practical approach to analyzing economic shifts yourself:

  1. Identify Key Metrics: Start by understanding the core indicators beyond nominal GDP. Research GDP per capita (economic output per person), Gini coefficient (income inequality), Human Development Index (HDI) (health, education, and standard of living), and foreign direct investment (FDI). These provide a more nuanced picture of a nation's economic health and societal well-being.
  2. Select a Timeframe and Nations: Choose a specific period (e.g., post-WWII, the last decade) and a few countries you wish to compare. Consider nations with contrasting economic trajectories (e.g., a rapidly growing economy vs. a developed but slower-growing one).
  3. Gather Data: Utilize resources like the World Bank Data portal, IMF Data, and the Maddison Project Database. Look for trends in your chosen metrics for your selected nations over your chosen timeframe.
  4. Research Contributing Factors: For significant shifts (e.g., a nation's rapid growth or decline), investigate the underlying causes. This might involve researching:
    • Government Policies: Trade agreements, fiscal policies, industrial strategies, investments in education and infrastructure.
    • Technological Advancements: Adoption of new technologies, innovation hubs, R&D spending.
    • Geopolitical Events: Wars, trade disputes, political stability, membership in international organizations.
    • Demographic Changes: Population growth, aging populations, migration patterns.
    • Resource Availability: Dependence on natural resources, shifts in global commodity prices.
  5. Visualize Trends: Create simple charts or graphs (even by hand or using basic spreadsheet software) to visually represent the data. This can help identify patterns and correlations more easily.
  6. Synthesize Findings: Draw conclusions about the relationships between different factors and economic performance. Formulate hypotheses about why certain countries succeeded while others faltered. For example, you might observe a correlation between investment in education and long-term economic growth.
  7. Connect to Broader Theories: Relate your findings to established economic theories (e.g., developmental economics, theories of globalization, comparative advantage). This enhances the intellectual depth of your analysis.

By actively engaging with the data and historical context, you can develop a deeper, more critical understanding of the forces shaping global economies.

Frequently Asked Questions

Q1: What is the difference between nominal GDP and GDP adjusted for Purchasing Power Parity (PPP)?
A1: Nominal GDP measures economic output at current market exchange rates, while GDP (PPP) adjusts for differences in the cost of living across countries, providing a potentially better comparison of living standards.

Q2: Why does the IMF provide projections for future GDP?
A2: Projections help governments, businesses, and international organizations make informed decisions about investments, policy planning, and resource allocation by offering an outlook based on current trends and assumptions.

Q3: How reliable are GDP projections, especially for developing countries?
A3: Projections are based on existing data and models, making them subject to change. They are generally less reliable for developing countries due to greater economic volatility, less robust data collection, and susceptibility to external shocks.

Q4: Besides GDP, what other indicators are important for assessing a country's economic strength?
A4: Key indicators include GDP per capita, unemployment rates, inflation rates, national debt, trade balance, foreign direct investment (FDI), and measures of income inequality and human development (like the HDI).

Conclusion: The Ever-Evolving Global Economy

The journey from 1900 to the projected landscape of 2030 is a testament to the dynamic and often unpredictable nature of global economic power. We have witnessed the transition of economic hegemony, the rise of new industrial titans, and the enduring influence of established economies adapting to new realities. The data underscores a clear trend: a gradual but persistent shift of economic gravity towards Asia, driven by the remarkable growth of nations like China and India.

While nominal GDP remains a primary metric for economic scale, a holistic understanding requires considering other factors such as PPP, human development, and technological innovation. The ability to adapt, innovate, and integrate into the global economy will continue to be paramount for national prosperity. As we move further into the 21st century, the interplay of economic forces, geopolitical developments, and technological advancements will undoubtedly continue to shape this ever-evolving global narrative.

"The global economy is a complex ecosystem, where past performance is indicative but not determinative of future outcomes. Understanding its historical currents is our best guide to navigating its future."

Further exploration into specific national economic histories and the impact of globalization on different regions would provide even deeper insights. We encourage our readers to engage with this data, conduct their own analyses, and contribute to the ongoing discourse on economic history and its implications for our shared future.

Military Spending in Latin America: A Historical and Sociological Analysis (1832-2022)

Introduction: The Weight of Arms in Latin America

The specter of military expenditure has long cast a significant shadow over the socio-political and economic landscape of Latin America. From the nascent years following independence to the complex geopolitical realities of the 21st century, nations across this vibrant continent have consistently allocated substantial resources towards defense. This article embarks on an academic exploration, synthesizing anthropological, sociological, and historical perspectives to dissect the evolution, drivers, and consequences of military spending in Latin America between 1832 and 2022. We aim to move beyond mere data presentation, seeking to understand the intricate interplay of historical legacies, internal social structures, and external geopolitical pressures that shape these crucial budgetary decisions.

The intention behind this deep dive is to provide a comprehensive understanding for the academic researcher, the curious student of history and sociology, and anyone seeking to comprehend the persistent role of the military in Latin American development. By examining historical trends, we can illuminate recurring patterns and emergent challenges. This analysis will also consider the practical implications, offering tools for individuals to engage with and interpret such data themselves.

The Shifting Sands of Defense Budgets: An 1832-2022 Overview

The period from 1832 to 2022 represents a transformative era for Latin America, marked by nation-building, internal conflicts, regional rivalries, and evolving international relations. Charting military spending across these nearly two centuries reveals a complex tapestry, far from a linear progression.

In the immediate post-independence decades (mid-19th century), newly formed nations often maintained relatively modest military establishments, primarily focused on internal consolidation and border security. However, recurrent **conflicts** and **nationalism** fueled periods of increased defense investment. The late 19th and early 20th centuries saw some Latin American countries, particularly those with stronger economic bases, begin to modernize their armed forces, often influenced by European military doctrines.

The mid-20th century brought a dramatic shift, largely driven by the Cold War. The ideological struggle between the United States and the Soviet Union had a profound impact on military spending patterns across the globe, and Latin America was no exception. Many nations received military aid and training from the US, leading to an expansion and professionalization of their armed forces, often in the name of combating internal subversion and communist movements. This era witnessed the rise of military dictatorships in several countries, directly correlating with increased defense budgets.

The Cold War era, in particular, saw a significant escalation in military expenditure across Latin America, often driven by external geopolitical agendas and internal security concerns, frequently eclipsing investments in crucial social and economic development.

Following the return to democracy in many Latin American nations from the late 1970s onwards, there was a general trend towards reducing military spending as a proportion of GDP. However, this trend was not uniform and was often punctuated by periods of renewed tension, such as border disputes or the rise of transnational organized crime. The early 21st century has seen a resurgence in discussions around defense budgets, influenced by evolving threats, including **cybersecurity** challenges and the persistent issue of internal security, particularly related to drug trafficking and organized crime. Analyzing data from sources like Our World in Data and the World Bank is crucial for discerning these nuanced historical trajectories.

Sociological Drivers of Military Expenditure

Beyond historical events and geopolitical pressures, the decisions surrounding military spending are deeply embedded within the social fabric of Latin American nations. Understanding these sociological drivers is key to a holistic analysis.

  • Internal Security Concerns: The persistent challenges posed by organized crime, drug cartels, insurgent groups, and social unrest have been major catalysts for maintaining or increasing military budgets. The perception of these threats often translates directly into demands for greater state capacity, frequently involving the military.
  • National Identity and Sovereignty: For many Latin American nations, a strong military is perceived as a symbol of national sovereignty and independence. This sentiment can influence public opinion and political discourse, making significant defense cuts politically challenging. The historical struggle for **independence** and subsequent assertions of sovereignty against external powers continue to resonate.
  • Social Stratification and Power Dynamics: Military institutions often hold significant social and political influence. In some contexts, military spending can be linked to maintaining existing power structures or to internal political rivalries where defense procurement becomes a tool of influence or patronage. The concept of **social stratification** is crucial here, as different segments of society may perceive defense spending and its benefits differently.
  • The Role of Elites: Historically, political and economic elites have played a significant role in shaping defense policies. Their interests, whether related to maintaining internal order, projecting regional power, or benefiting from defense contracts, can heavily influence budget allocations.
The discourse surrounding military spending is often intertwined with narratives of national pride and security, making it a sensitive issue deeply connected to collective identity and perceived threats within Latin American societies.

The interplay between these sociological factors and actual budgetary decisions is complex. Public perception, media influence, and advocacy by military or industrial interests all contribute to the ongoing debate about the appropriate level of military expenditure.

Economic Ramifications: Opportunity Costs and Development

The allocation of significant financial resources to the military inevitably entails opportunity costs. While defense spending can stimulate certain sectors of the economy and provide employment, it often diverts funds from other critical areas of development.

Opportunity Costs: Funds allocated to defense could otherwise be invested in education, healthcare, infrastructure, or social programs. This trade-off is a central point of debate when evaluating military budgets. For instance, an investment in military hardware might mean fewer resources for building schools or hospitals, impacting long-term human capital development and societal well-being.

Economic Stimulus: Defense industries can contribute to technological innovation and create specialized jobs. Military procurement can also inject capital into certain regions. However, the broader economic benefits of military spending are often debated, with many economists arguing that equivalent investment in civilian sectors yields greater overall economic growth and employment.

Debt and Fiscal Stability: Sustained high levels of military spending can place a strain on national budgets, contributing to fiscal deficits and increasing national debt. This can have long-term implications for a country's economic stability and its ability to finance essential public services. Analyzing **economic growth** data alongside military expenditure reveals potential correlations.

The relationship between military spending and economic development in Latin America is multifaceted. While some argue that a secure environment, facilitated by strong defense, is a prerequisite for investment, others contend that excessive military expenditure hinders the very development it aims to protect by siphoning off vital resources.

Geopolitical Undercurrents and Regional Dynamics

Latin America's military spending is not solely an internal affair; it is profoundly shaped by regional and global geopolitical currents.

  • Regional Rivalries and Arms Races: Historically, border disputes and perceived threats from neighboring countries have fueled regional arms races. While large-scale interstate wars have become less common since the mid-20th century, simmering tensions and strategic competition can still influence defense postures and spending.
  • Influence of Global Powers: The historical and ongoing influence of major global powers, particularly the United States, has significantly impacted defense policies and procurement in Latin America. Military aid, arms sales, and security cooperation agreements can shape national defense priorities and budget allocations.
  • Transnational Threats: The rise of transnational criminal organizations, drug trafficking networks, and illegal resource exploitation poses complex security challenges that require significant military and law enforcement resources. Addressing these issues often necessitates regional cooperation but also fuels individual national defense spending. The phenomenon of **imperialist aggression** is a historical lens through which some scholars interpret these dynamics.
  • Peacekeeping and International Engagement: In recent decades, some Latin American nations have increased their engagement in international peacekeeping operations. While these missions contribute to global security, they also represent a commitment of resources and personnel that impacts national defense budgets.

Understanding these geopolitical factors requires examining international relations, **diplomacy**, and the shifting global power balance. The dynamics between **Latin America** and other regions are crucial for a complete picture.

DIY Practical Guide: Analyzing Military Spending Data

Engaging directly with data is a fundamental aspect of academic inquiry and personal understanding. This guide offers a practical, step-by-step approach to analyzing military spending data, embodying the "Do It Yourself" spirit.

  1. Identify Reliable Data Sources: Begin by locating reputable sources. Organizations like Our World in Data, the World Bank, the Stockholm International Peace Research Institute (SIPRI), and national statistical agencies (e.g., INEGI in Mexico for broader statistical context, though not directly military spending) are excellent starting points. Look for datasets covering the time period and geographical region you are interested in.
  2. Understand the Metrics: Military spending can be presented in various ways:
    • Absolute Figures (USD): The total amount spent.
    • As a Percentage of GDP: This indicates the proportion of the national economy dedicated to defense, useful for comparing countries of different economic sizes.
    • Per Capita Spending (USD): The amount spent per person, offering insight into the burden on individual citizens.
    • As a Percentage of Government Expenditure: Shows how defense spending compares to other government priorities.
    Choose the metric(s) most relevant to your research question. For historical comparisons, percentages of GDP or government expenditure are often more stable than absolute figures due to inflation and currency fluctuations.
  3. Data Acquisition and Cleaning: Download the relevant datasets. Most sources provide data in formats like CSV or Excel. You may need to clean the data by handling missing values (e.g., using interpolation or exclusion, depending on the context) and ensuring consistency in units and country names. Tools like spreadsheets (Excel, Google Sheets) or data analysis software (R, Python with Pandas) are useful here.
  4. Visualization: Visualizing the data is crucial for identifying trends and patterns.
    • Line Graphs: Ideal for showing trends over time for a single country or comparing multiple countries. Plot time on the x-axis and the chosen metric (e.g., % of GDP) on the y-axis.
    • Bar Charts: Useful for comparing spending across different countries at a specific point in time or for showing the breakdown of spending categories.
    • Maps: For geographical distribution, though direct military spending maps are less common than economic or demographic ones. You can use choropleth maps to show the % of GDP spent on defense across different countries in a given year.
    Consider using charting tools within spreadsheet software or specialized libraries in R/Python for more advanced visualizations.
  5. Contextualize and Interpret: Data alone is insufficient. Overlay your findings with historical events, political changes, and sociological factors discussed earlier. Ask critical questions:
    • Why did spending increase or decrease in a particular period?
    • What major events (wars, treaties, crises) coincide with these changes?
    • How does this spending compare to regional averages or global trends?
    • What are the potential socio-economic consequences of these spending patterns?
    Consult academic literature, historical accounts, and analyses from organizations focused on peace and security to deepen your interpretation. Ensure you are aware of the limitations of the data and the potential biases in reporting.

Frequently Asked Questions

What are the main factors influencing military spending in Latin America?

Key factors include historical legacies of conflict, perceived national security threats (internal and external), geopolitical influences from global powers, internal political dynamics, and the economic capacity of the state. The rise of transnational crime has also become a significant driver in recent decades.

Has military spending in Latin America increased or decreased over time?

The trend is complex and varies by country and period. While there was a general reduction in the proportion of GDP dedicated to defense following the end of the Cold War and transitions to democracy, spending has seen fluctuations due to regional tensions, internal security challenges, and evolving geopolitical landscapes. Recent years have seen renewed attention to defense budgets in some nations.

What are the economic opportunity costs of high military spending?

The primary opportunity cost is the diversion of financial resources that could otherwise be invested in critical sectors such as education, healthcare, infrastructure, and social development. This can hinder long-term human capital formation and overall societal progress.

How can I access reliable data on military spending in Latin America?

Reliable sources include academic databases, reports from international organizations like Our World in Data, the World Bank, and the Stockholm International Peace Research Institute (SIPRI). National statistical agencies also provide relevant data.

Conclusion: Towards a More Peaceful Future?

The journey through military spending in Latin America from 1832 to 2022 reveals a persistent and often substantial allocation of resources towards defense. This pattern is not a simple reflection of external threats but a complex amalgamation of historical inertia, internal social and political structures, economic considerations, and regional geopolitical dynamics. From the consolidation of post-colonial states to the ideological battles of the Cold War and the contemporary challenges of transnational crime, the military has remained a central, albeit evolving, institution shaping the continent's trajectory.

Understanding these trends is not merely an academic exercise; it carries profound implications for development, governance, and the pursuit of sustainable peace. The significant opportunity costs associated with high military expenditures highlight the critical need for informed public discourse and policy decisions that prioritize human security and long-term societal well-being. As Latin American nations continue to navigate a complex global landscape, critical analysis of military spending remains paramount. The "DIY" approach empowers individuals to engage with this data, fostering greater transparency and accountability. Ultimately, the aspiration for a more peaceful and prosperous Latin America hinges on a nuanced understanding of the past and a forward-looking commitment to rebalancing priorities towards development and human flourishing.